
Trading Full Course
Learn Stock Market Trading from Beginner Basics to Advanced Strategies, Risk Management, and Practical Market Skills

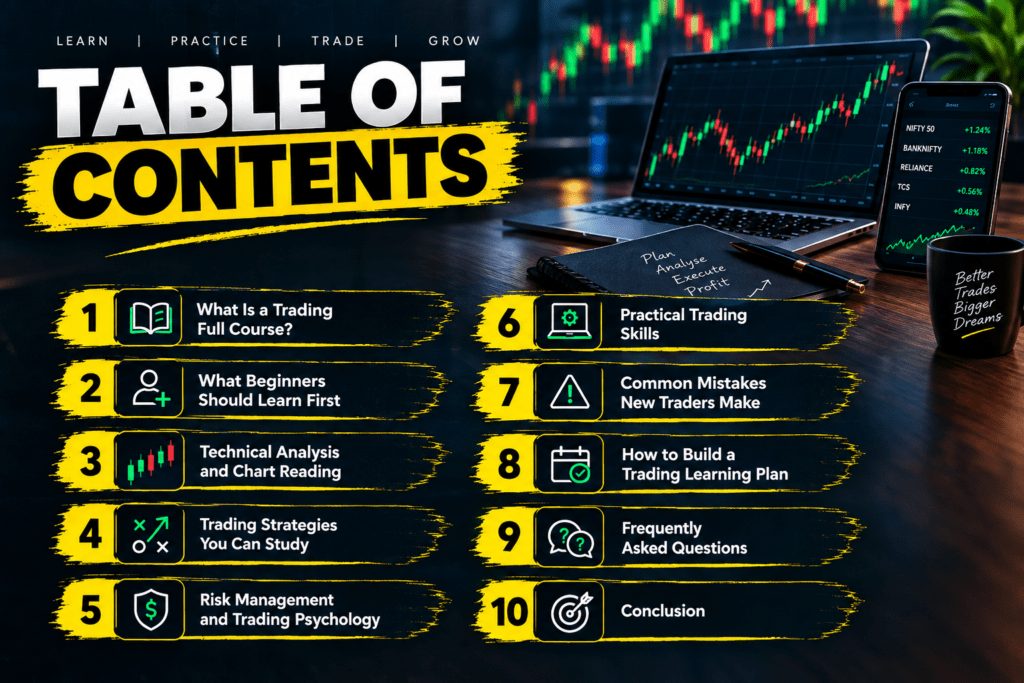
Table of Contents
- What Is a Trading Full Course?
- What Beginners Should Learn First
- Technical Analysis and Chart Reading
- Trading Strategies You Can Study
- Risk Management and Trading Psychology
- Practical Trading Skills
- Common Mistakes New Traders Make
- How to Build a Trading Learning Plan
- Frequently Asked Questions
- Conclusion
Introduction
Learning how the stock market works can feel confusing when you are starting out. There are charts, candlestick patterns, indicators, trading strategies, risk management rules, and hundreds of opinions online. A structured trading full course can make the learning process easier by putting these topics in the right order.
For someone between 18 and 25, trading education should not begin with the promise of quick profits. It should begin with understanding how markets work, how orders are placed, how price moves, and how much risk a trader can realistically take.
A good learning process combines theory with practical chart observation. Over time, you can develop your own trading plan instead of simply copying another person’s entries.
What Is a Trading Full Course?
A trading full course is a structured learning program that covers the major concepts required to understand and practice financial market trading.
Instead of learning random topics from different sources, a complete curriculum usually moves from basic concepts toward more advanced subjects.
A well structured course may cover:
- Stock market fundamentals
- Trading terminology
- Market orders and limit orders
- Candlestick patterns
- Support and resistance
- Trend analysis
- Technical indicators
- Chart patterns
- Trading strategies
- Risk management
- Position sizing
- Trading psychology
- Backtesting
- Paper trading
- Trade journaling
- Advanced market analysis
The important point is that completing a course does not automatically make someone a profitable trader. Trading skill develops through education, practice, observation, testing, and disciplined risk control.
What Beginners Should Learn First
Before studying complicated indicators or advanced strategies, beginners should understand the foundation.
1. Understand the Stock Market
Start by learning what stocks represent and how exchanges work. Understand concepts such as market capitalization, liquidity, volatility, bid price, ask price, and trading volume.
You should also understand the difference between investing and trading.
Trading generally focuses more heavily on price movements and shorter time horizons, while investing often involves holding assets for longer periods based on fundamental or business considerations.
2. Learn Different Trading Styles
There is no single trading style that fits everyone.
Common styles include:
- Intraday trading
- Swing trading
- Position trading
- Momentum trading
- Breakout trading
For example, a student with limited time may find it more practical to study swing trading concepts than to constantly monitor an intraday chart.
The goal at the beginning should be understanding the characteristics and risks of each approach rather than immediately choosing one.
Technical Analysis and Chart Reading
Technical analysis is an important part of many trading education programs. A technical analysis course can help learners understand how traders study historical price and volume information.
Support and Resistance
Support is a price area where buying interest has previously appeared. Resistance is an area where selling pressure has previously appeared.
These are not guaranteed turning points. Price can move through either level when market conditions change.
For example, suppose a stock repeatedly struggles around ₹500. A trader might mark ₹500 as a resistance area and watch how price behaves if it approaches that level again.
Candlestick Patterns
Candlesticks provide information about price movement during a particular period.
Beginners commonly study:
- Doji
- Hammer
- Shooting star
- Engulfing patterns
- Morning star
- Evening star
A common mistake is treating one candlestick as a guaranteed buy or sell signal. A pattern becomes more meaningful when considered alongside trend, support and resistance, volume, and broader market conditions.
Indicators
Technical indicators can help organize market information.
Popular examples include:
- Moving averages
- Relative Strength Index
- Moving Average Convergence Divergence
- Average True Range
- Bollinger Bands
Indicators should support analysis rather than replace it. Using ten indicators at once can create more confusion than clarity.
Trading Strategies You Can Study
Once you understand charts, you can start studying specific strategies.
Breakout Trading
A breakout occurs when price moves beyond a previously established trading range or important level.
For example, if a stock has traded between ₹450 and ₹480 for several weeks, a trader may watch how price behaves if it moves above ₹480.
However, breakouts can fail. That is why volume, market context, confirmation, and risk management matter.
Trend Following
Trend following focuses on identifying sustained upward or downward price movement.
A simple learning exercise is to open historical charts and identify:
- Higher highs
- Higher lows
- Lower highs
- Lower lows
- Consolidation periods
Doing this repeatedly can improve chart reading without putting real money at risk.
Swing Trading
Swing trading generally attempts to capture price movements that develop over several days or weeks.
A basic study process might involve identifying a trend, marking important price levels, defining an entry condition, deciding where the trade idea becomes invalid, and calculating the potential risk.
Risk Management and Trading Psychology
Risk management is one of the most important areas in any trading full course.
A trader can have a reasonable strategy and still experience significant losses if position size is too large or risk is poorly controlled.
Important concepts include:
- Position sizing
- Stop loss
- Risk to reward ratio
- Maximum loss limits
- Portfolio exposure
- Capital preservation
Example of Position Sizing
Suppose a trader has ₹100,000 available as trading capital and decides that the maximum acceptable loss on one trade is ₹1,000.
If the planned stop loss represents a ₹10 loss per share, the position size based on that risk limit would be:
₹1,000 ÷ ₹10 = 100 shares
This is only an educational example. Actual position sizing should also account for liquidity, transaction costs, slippage, market conditions, and the trader’s overall financial circumstances.
Trading Psychology
Trading involves uncertainty. A strategy will not produce successful outcomes on every trade.
Common psychological challenges include:
- Fear after a loss
- Greed after a winning trade
- Revenge trading
- Overtrading
- Moving a stop loss
- Entering because of social media recommendations
A trading journal can help identify these behavioral patterns.
Practical Trading Skills
Knowledge becomes more useful when you apply it systematically.
A beginner can create a simple practice routine.
Step 1: Study Historical Charts
Choose several liquid stocks or market indices and examine their historical price movements.
Mark:
- Trends
- Support areas
- Resistance areas
- Breakouts
- Failed breakouts
- High volume movements
Step 2: Paper Trade
Paper trading allows you to practice a strategy without risking actual trading capital.
Record every simulated trade, including:
- Entry price
- Exit price
- Stop loss
- Position size
- Reason for entering
- Reason for exiting
- Result
- Mistake or lesson
Step 3: Backtest Your Idea
Backtesting means applying a trading method to historical market data to understand how it would have behaved in the past.
Past performance does not guarantee future results, but historical testing can reveal weaknesses that may not be obvious from a few recent trades.
Step 4: Maintain a Trading Journal
A journal can become one of your most useful learning tools.
After every trade, ask:
- Did I follow my trading plan?
- Was the entry based on my predefined setup?
- Did I take unnecessary risk?
- Did emotions influence my decision?
- What would I change next time?
Common Mistakes New Traders Make
Beginners often focus heavily on finding the perfect entry while giving less attention to risk.
Some common mistakes include:
- Trading without a defined plan
- Using excessive leverage
- Risking too much on one position
- Copying social media trades
- Changing strategies after a few losses
- Ignoring transaction costs
- Trading with money needed for essential expenses
- Expecting consistent profits immediately
A useful rule for beginners is simple: learn first, test second, and increase exposure only when you understand the risks involved.
How to Build a Trading Learning Plan
If you are studying independently, divide your education into stages.
Stage 1: Market Foundations
Learn market terminology, order types, exchanges, liquidity, volatility, and basic stock market concepts.
Stage 2: Technical Analysis
Study price action, candlesticks, trends, support and resistance, chart patterns, volume, and technical indicators.
Stage 3: Strategy Development
Study a small number of strategies and define precise entry, exit, and risk conditions.
Stage 4: Practice
Use historical charts, paper trading, and backtesting to evaluate your understanding.
Stage 5: Risk Management
Learn position sizing, stop loss placement, risk limits, and portfolio exposure.
Stage 6: Review
Maintain a trading journal and regularly review your decisions.
For related learning, you can also explore your [Trading Course Fee] page through an internal link on your website. This gives readers a natural next step if they want information about course structure and pricing.
For independent market education, learners can also consult resources from established financial institutions and regulators such as SEBI and NSE India.
FAQ's
Find ansswers to commonly asked questions about our services and trading strategie
What is a trading full course?
A trading full course is a structured educational program covering subjects such as market fundamentals, technical analysis, trading strategies, risk management, psychology, and practical trading exercises.
Is a trading full course suitable for beginners?
Yes. A properly structured course can introduce beginners to market terminology and basic concepts before progressing toward technical analysis and strategy development.
What does a technical analysis course teach?
A technical analysis course generally teaches learners how to study price charts, candlestick formations, trends, support and resistance, volume, chart patterns, and technical indicators.
How long does it take to learn trading?
The learning period varies considerably. Basic market concepts can be learned relatively quickly, but developing practical skills requires continued study, chart observation, testing, and review.
What should I learn before using technical indicators?
Learn market structure, price action, trends, support and resistance, and basic risk management first. Indicators are easier to understand when you already know what the underlying price is doing.
Conclusion
A trading full course can provide a useful roadmap for someone who wants to understand the stock market in a structured way. The most valuable learning path is not simply a collection of indicators and entry signals.
Start with market fundamentals. Move into technical analysis. Study a small number of trading strategies. Then practice through historical charts, paper trading, and journaling.
Most importantly, learn risk management before focusing heavily on potential returns. Trading involves uncertainty, and no strategy can eliminate losses entirely.
The objective of trading education should be to help you make informed decisions, understand risk, and develop a repeatable process.